
TODD J. LEBLANC, B.SC., M.SC.
NUTRIEN, GEOPHYSICIST-IN-TRAINING, TODD.LEBLANC@NUTRIEN.COM
MATTHEW VAN DEN BERGHE, B.SC., P.GEO.
NUTRIEN, SENIOR GEOPHYSICIST, MATTHEW.VANDENBERGHE@NUTRIEN.COM
NATHAN MORGAN, B.SC., P.GEO.
NUTRIEN, MANAGER – GEOSERVICES, NATHAN.MORGAN@NUTRIEN.COM
CRAIG FUNK, M.SC., P.ENG, P.GEO.
NUTRIEN, DIRECTOR – GEOSERVICES AND LAND, CRAIG.FUNK@NUTRIEN.COM
Abstract
Saskatchewan hosts one of the largest potash deposits in the world. The world-class resource, mined from the Prairie Evaporite Formation, is flat lying and homogeneous across vast areas, making for very efficient, relatively low-cost mining. Mine-threatening geohazards, such as salt-collapses and zones of fractured cap-rock, can be successfully imaged well in advance of mining, using 3-D seismic; nevertheless, small, typically undetectable, sub-seismic geological anomalies capable of disrupting production are sometimes encountered during the course of mining. The characterization of these anomalies is a critical task for further mitigating any potential risk to operations and the safety of the mine workers.
In this case study, we describe how, utilizing a combination of surface 3-D seismic and in-mine geophysical methods including ground penetrating radar (GPR) and frequency-domain electromagnetics (FDEM), a complex, sub-seismic geological anomaly was characterized iteratively while mining advanced through the area. This work would not have been possible without strong and rapid interdisciplinary collaboration among geoscientists, engineers, and mine planners. Informed by existing 3-D seismic, mine operations anticipated challenging mining conditions in the area; however, the severity of the structural features encountered in the course of mining was unexpected. This necessitated the deployment of various geophysical instruments to fully classify the anomaly. The results underscore the need for open avenues of communication across disciplines, and adaptive strategies to manage risks associated with mining in complex geological settings. Additionally, the results emphasize the value of integrating multiple geophysical techniques to provide a comprehensive and more informed understanding of geological conditions.
Introduction
The potash ore mined by Nutrien Ltd. (Nutrien) is located within the Prairie Evaporite Formation, which is Devonian in age. Potash deposits in Saskatchewan, on a regional scale, are near-uniform with horizontally bedded stratigraphy both within the potash layers and above (Broughton, 2019). Anomalies are uncommon; however, when they occur, often correlate with other more significant changes in fluid porosity and structural integrity in stratigraphic layers both above and below the Prairie Evaporite (Baar, 1974; Gendzwill and Stead, 1992; Cisyk, 2020). On rare occasions, geological anomalies can manifest when the mine workings intersect such features.
Geophysics is used both from within the mine and from surface to image and characterize geological anomalies prior to intersecting them. One geophysical method of particular note is the extensive use of 3-D seismic from surface to map areas prior to mine expansion (Gendzwill and Stead, 1992). Additionally, groundpenetrating radar (GPR) is used in real-time during mining to detect the proximity of clay seams in the salt-rock roof (salt-back) of the mine. These clay seams form planes of weakness, contributing to failures in the salt-back and, in the absence of rock bolting and other ground support, rockfalls (Funk et al., 2017). These two methods form the backbone of the hazard mitigation strategies prior to – and concurrent with – mining, typically characterizing both large (seismic) and small (sub-seismic) features.
Recently, a mine site encountered a sub-seismic anomaly. At this location, a sudden and significant change in the dip of the clay layers could be seen in the mine walls and the continuous boring machine (borer) GPR display. Borers are used to mechanically cut potash ore from the potash seams. Upon further advancement through the anomaly, the clay seams reappeared and dove into the floor, appearing both in the face and wall. Once mine engineering realized that they were likely progressing towards a sub-seismic salt-collapse feature, mining was paused for geophysical investigations. Various geophysical instruments were brought underground to the mining area to characterize the anomaly, and in parallel, a comprehensive review of the available seismic data was undertaken. Presented below are the results of these efforts.
Background to Potash Mining
Immediately overlying the potash-bearing zone is the Dawson Bay Formation and its Second Red Bed Member, which act as a non-permeable caprock. Overlying the caprock is the Souris River Formation – made up of several sequences of shales, carbonates and evaporites. Some of the members of the Souris River are porous aquifers (Ahlstrom, 1992). Fracturing, porosity variations, and compromised structural integrity of the caprocks proximal to the mine are of interest to mining operations. Their proximity to the mining horizon increases the likelihood of inflows. Such ingress of fluids can lead to erosion of the mine room supports, which can further destabilize the surrounding area, enhancing flow-paths One of the most critical geohazards in this regard are salt-collapses. Salt-collapses are brecciated, permeable, columnar features – extending from the Prairie Evaporite Formation into the overlying Dawson Bay Formation and often even higher in the stratigraphy. Mapping, mitigation and avoidance of these features are vital to minimizing operational hazards (Gendzwill & Stead, 1992; Boys,1993; Funk et al., 2019).
Surface 3-D seismic, used to assess areas ahead of mining, highlights salt-collapse zones, because the normal reflectors are suddenly absent. Surface 3-D seismic is commonly acquired at Nutrien using either dynamite or vibroseis sources, with a resulting 30 m X 30 m natural bin size and a Rayleigh resolution at mine-level of approximately 11 m. The Rayleigh criterion is outlined by Kallweit & Woods (1982). However, given these typical resolutions and bin sizes, anomalies smaller than 100 m are difficult to resolve with seismic methods alone.
When mining occurs and ground conditions are uncertain, other geophysical methods are routinely deployed within the mine room (typically referred to as “in-mine geophysics”) to build a higher resolution sub-surface image. These in-mine geophysical methods include GPR, reflection and refraction seismic, and electromagnetics (Gendzwill & Stead, 1992; Funk et al., 2016; Funk et al., 2017; Funk et al., 2019; LeBlanc & Butler, 2024). The cost of these methods varies depending on their impact to active mine operations. GPR is typically less invasive and can be collected continuously while mining advances; however, the depth of penetration in GPR is low. Other methods like EM and in-mine seismic have much deeper penetration but are quite disruptive to mining operations and are thus used sparingly.
Anomalous Geological Case Study
The Saskatoon area potash mines extract ore from the Upper Patience Lake Member of the Prairie Evaporite Formation. The Upper Patience Lake Member contains several clay markers such as the “413”, “412”, “411”, and the “410” (Boys, 1990). They are used as a guide for the borer. In general, these clay layers are horizontal, with only small variation in elevation. Figure 1 illustrates the location of the Patience Lake ore zone and the relative positions of the clay seams within the stratigraphy.

Figure 1. Diagram showing the location of the Patience Lake Member relative to the wider Prairie Evaporite Formation and the location of the clay seams within the Upper Patience Lake Member. (Diagram modified from Yang et al., 2009; Funk et al., 2017; and Broughton, 2019.)
Recently, a potash mine site in the Saskatoon area encountered a situation where these clay markers unexpectedly appeared sub-vertical in the mine room, following a short segment of washout where the sylvite and clays had been replaced with halite. All of this occurred over a relatively small distance of less than 40 m. Figure 2(a) shows the mine wall about 48 m from the current face of the mine. Figure 2(b) shows the same wall about 20 m from the face of the mine room where clay seams dip upwardly and disappear into the overlying salt-back.
Surface 3-D seismic in the area of this study indicated relatively normal geology with only a few features of interest, such as a local rise in the Winnipegosis Formation below the Prairie Evaporite. These features are referred to as “mounds” and are known to often correlate with other minor anomalous features more proximal to the mining horizon, such as changes in the thickness of the Prairie Evaporite (Gendzwill, 1978). One other subtle anomalous signature detected was the dip gradient attribute of the Second Red Bed shown in Fig. 3(a). Near where the anomaly was intersected in the mine room, there exists an unexpected increase in the dip gradient co-locating with the north side of the inner mound core. The anomaly was intersected about 50 m southeast of this Second Red Bed gradient feature. Another important seismic attribute for our analysis is semblance. Semblance is a measure of the similarity of adjacent seismic traces. Semblance extracted along the Second Red Bed is shown in Fig. 3(b). This minor variance in the semblance appears to map the anomaly closely. However, a semblance of 0.9 is still relatively high and in most cases would be considered a normal response of the Second Red Bed. The resulting interpretation was that seismic alone was not enough, in this case, to explain or predict the presence of the encountered anomaly.

Figure 2. Images of the mine wall, various distances from the face of the room. Pictures taken using a RIEGL VZ-600i Terrestrial Laser Scanner. Also shown are plan views of the area near the anomaly. Blue points show the picture locations (not all are shown in this manuscript). The red points show the location and direction of the respective displayed images. 2a) shows the wall 48 m from the face. The 412 Clay is visible, flat lying, and “normal”. 2b) shows the mine wall 20 m from the face. At this point, several clays can be seen dipping away from the face.

Figure 3. Various seismic attributes calculated at the area of the Second Red Bed anomalous feature. Winnipegosis Mound edge highlighted in pink. Mine room location highlighted in orange. 3a) Second Red Bed Dip Gradient. 3b) Second Red Bed Semblance Anomalies (black shows poor semblance).
In-Mine Geophysics
Additional geophysical work can be performed in-mine to classify encountered anomalies and access future mining potential. These efforts often require extensive collaboration between diverse teams and disciplines, including mine planners, engineers, and operators. The need for space to operate geophysical instruments underground requires that mining infrastructure be removed from the area. This is a nontrivial task. Some geophysical instruments, such as FDEM, require the further removal of metal infrastructure from the area to reduce inductive signal noise.
Two in-mine methods were used in the anomalous area of the mine. The first method was GPR. The difference in electrical properties between salt and clay is measurable and produces a GPR reflection. GPR has been used underground in both investigative and routine situations in potash mining for decades and the method has seen many recent improvements (Funk et al., 2017; Funk et al., 2020; Okonkwo et al., 2023). Various depths in the floor or salt-back can be imaged using appropriate frequencies. Typically, an upward-looking 1000 MHz GPR antenna is used to image the salt-back (see Funk et al., 2016). In this case study, an increased depth of investigation was required. Follow-up utility terrain vehicle (UTV) mounted, upward-looking GPR was collected with a 250 MHz GPR antenna. It was deployed using a Sensors and Software Noggin Gold DVL 500 recorder with an automatic stacking method and a station interval of 0.2 m. The average velocity of the salt-back is assumed to be 0.12 m/ns with an effective depth of investigation of around 3 m.
Collecting GPR data in this environment was a challenge. The irregularity of the clay seams can be seen in Fig. 4. The survey lines terminated at the face of the three rooms. Figure 4(a) shows the west room (Line 1). The anomalous geology was most severe in this room. The beginning of this line shows clay seams that are typically found in the floor disappearing up into the salt-back. Near the face, there is a subtle response of what appears to be the edge of a dipping reflector. This was our first indication of the presence of atypical geological structure in the salt-back above the mine room. Figure 4(b) shows the GPR profile in the center room (Line 2). This profile terminated the furthest south from the anomaly. In this room, the salt-back appears normal; the 414 clay is consistently present 1 meter into the salt-back. On the other hand, Fig. 4(c) shows the east room (Line 3). This profile demonstrates a structure lying somewhere between the other two rooms. At the start of this line, the 414 clay appears normal. Quite rapidly, over a few meters, the seam tilts upward and disappears from the GPR profile. Other clay seams enter the profile at a sharp angle, rising out of detectable range sequentially. The GPR demonstrates that within the anomaly, the clay seams are rapidly changing laterally – both along the profiles and between different rooms. Figure 4(d) shows the relative positioning and lengths of the three GPR lines.

Figure 4. 250 MHz GPR data. Displayed are three lines of data: 4a) line 1, 4b) line 2, and 4c) line 3. All lines terminate near the face to the north. 4d) Plan-view of GPR survey.
The next geophysical instrument that was deployed was an Apex Max-Min I-8 (Max-Min). This instrument is a FDEM system, typically used for shallow ground conductor mapping (Scott, 2014). This instrument measures the magnetic field produced by electrical currents in the ground in response to an excited field generated by a transmitting coil. The higher the conductivity of the sub-surface, the higher the response. The I-8 unit records frequencies ranging between 110 – 14,080 Hz. The depth of investigation is controlled by both the operational frequency and separation between the transmitter and receiver. In general, higher frequencies and narrower spacing between the transmitter and receiver will decrease the depth of investigation.
Four Max-Min survey lines of varying sampling density, lengths, and frequencies were collected at the site of the anomalous feature. Transmitter and receiver separation was set at 25 m. The 1760, 7040, and 14,080 Hz frequencies were collected at every station and can be seen in Fig. 5. Approaching the anomaly, a conductive response was seen in the 880 Hz and higher frequencies. In Fig. 5, yellow indicates a resistive, “normal” response, and blue indicates a conductive, anomalous response. In general, the conductive response showed a correlation with the occurrence of the clay seam anomalies seen both in the mine rooms and the GPR.
A conductive in-mine EM anomaly has several possible geological explanations, one being a reduction in the thickness of the overlying salt-back (caprock). An EM model showing the response from a decrease in the salt-back thickness above the mining horizon is shown in Fig. 6. Maintaining adequate salt-back thickness is vital to ensuring a tight seal from the more permeable geological layers higher up in the sequence (Gendzwill & Stead, 1992). As the salt-layer thins, the conductive Second Red Bed becomes more proximal, replacing the resistive salt. Figures 6(a) and 6(c) (top and bottom, left) show the theoretical in-phase and quadrature EM model response across a variety of modelled salt-back thicknesses. Figures 6(b) and 6(d) (top and bottom, right) show the Max-Min response relative to the distance south from the face of the mine room.
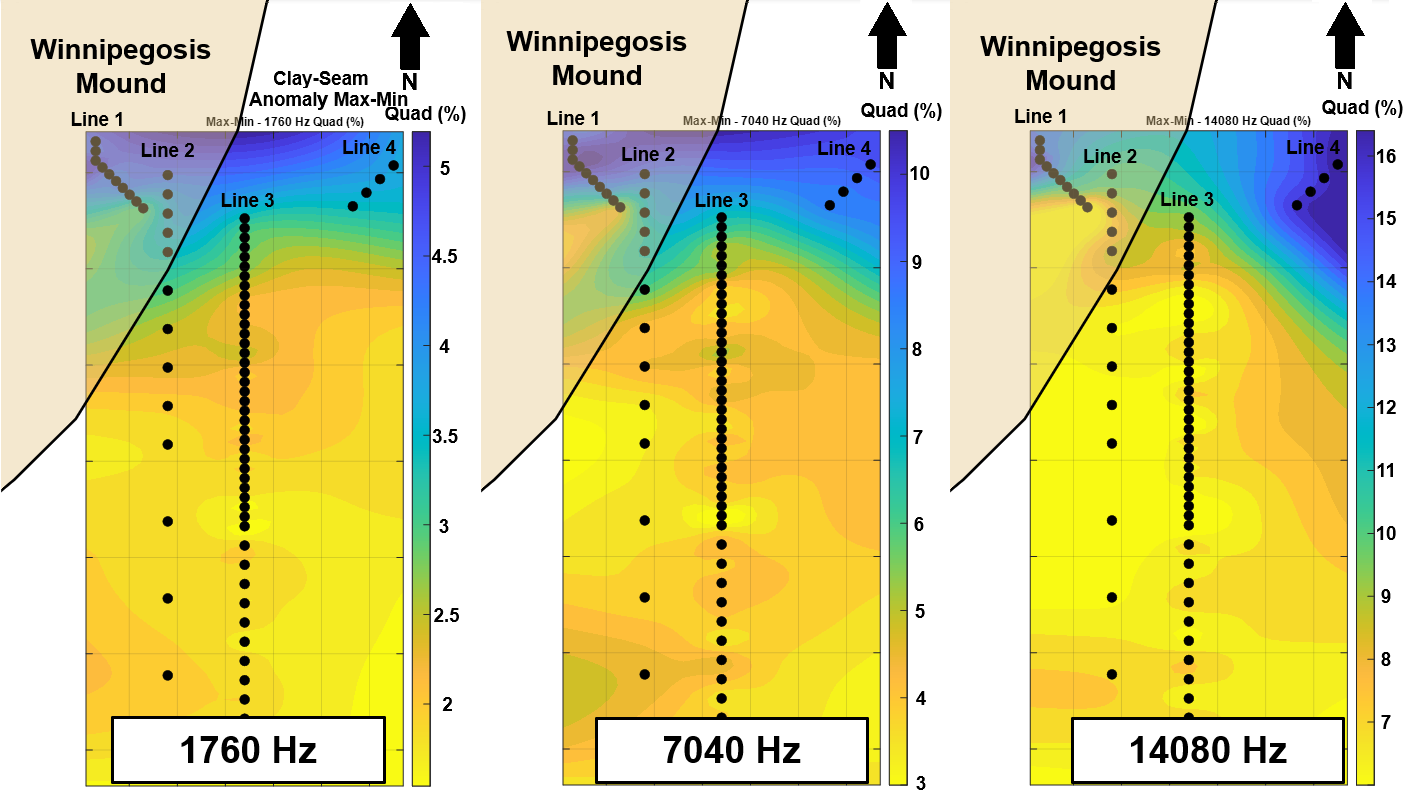
Figure 5. Max-Min survey near the face of the mine rooms. The quadrature from several different frequencies is plotted here. 5a) 1760 Hz, 5b) 7040 Hz, and 5c) 14080 Hz. Survey points in black.
The general trend across each FDEM line was an increasing quadrature and in-phase response (and thereby increasing conductivity) as proximity to the mine face increased. However, one encouraging sign was that the quadrature response did not reverse and begin decreasing in amplitude at the higher frequencies. This reversal would have indicated an extremely thin salt-back (< 6 m – see Fig. 6(c)) or the presence of nearby brine. The reversal from positive to negative correlation is due to the shifting of the excited field from outside the instrument array to inside and occurs in areas of high conductivity. The FDEM data, combined with the dipping reflector seen in Fig. 4(a), suggested a dry, proximal collapse containing Second Red Bed material.

Figure 6. Comparing the EM response in the Max-Min to a computer EM model. Line numbers from Fig. 5. The model shows a series of in-phase (a) and quadrature (c) EM responses across a variety of salt-back thicknesses. The in-phase (b) and quadrature (d) Max-Min data is shown against the distance south from the mine face in Line #1.
Geological Interpretation and Advancing the Mine Room
With the assurance from the geophysical surveys that the strata were dry, the decision was made to continue mining advancement in the area, hopeful that the core of the suspected collapse could be avoided. Unfortunately, a short distance later, the borer came into contact with a dry collapse of the Second Red Bed, halting any further advancement of the mine face. Figure 7(a)-(e) shows the mine face in five of the rooms. It appears that the mine rooms were roughly centered on an uprising in the potash layers, dipping to the west and east on either side of the panel. In Room #3, the collapse structure can be seen daylighting within the room. The steepest apparent dip of the clay seams occurs at the end of Room #1 where they have an apparent dip of 47° to the west. In Room #5, the clay seams have an apparent dip of 11° to the east. Figure 7(f)-(i) shows the entire face in each of the rooms. Overlain is a geological interpretation of the Upper and Lower Patience Lake Members as well as the presence of the Second Red Bed daylighting in Room #3.

Figure 7. Mine face in each room once mining had ceased. 7a) through 7e) show a portion of the mining face in detail. 7f) through 7j) show a wider view of each face with rough geological interpretations overlaid. UPL and LPL refer to the Upper and Lower Patience Lake potash members, respectively.
Conclusion
Small, sub-seismic anomalies within the Prairie Evaporite Formation can be quite disruptive for potash miners. When these geological anomalies are encountered, mine operations look to geophysical methods to effectively quantify these features and mitigate any latent hazards. The results of this study highlight the importance of using a variety of geophysical methods for this purpose – both surface and in-mine. Surface 3-D seismic data has proven effective in looking forward to identify, and therefore avoid, large-scale, mine-threatening features. Smaller, sub-seismic anomalies pose less concern; nevertheless, they cannot be detected pre-mining and, once exposed, should be investigated with all available tools. Surveying in-mine allows geophysicists the unique opportunity to use near-surface, upward-looking geophysical methods, such as GPR and FDEM, to image features at a kilometer depth that would be otherwise undetectable. Most importantly, this collaborative approach to geoscience enables informed decision-making for mining operations.
The area near an active mine room face is a challenging environment in which to conduct geophysical surveys. There are safety and operational considerations. In the case of electromagnetics, the need for additional removal of metal infrastructure adds to the challenge. Our process involved geologists and geological engineers informing the geophysics team of the geological features as they were presently understood. This allowed the geophysics team to select the appropriate equipment that could be rapidly deployed to the location. Following the choice of survey parameters and equipment, logistical information was relayed to the mine operators and planners. Several days of work were required to pull the metal and equipment from the face of the mine and give the geophysics survey operators the space to operate. This space (distance) was especially vital, as it allowed the geophysicists to establish a baseline level EM response. High confidence in the results was made possible through the collaboration between a diverse and specialized team of scientists, engineers, and mine operators in a complex and rapidly evolving situation.

References
Ahlstrom, J. H. (1992). Geology and Diagenesis of the Dawson Bay Formation in the Saskatoon Potash Mining District, Saskatchewan, (Master’s thesis, University of Saskatchewan). Harvest. http://hdl.handle.net/10388/7025
Barr, C. A. (1974). Geological problems in Saskatchewan potash mining due to peculiar conditions during deposition of potash beds. In A.H. Coogan (Ed. 1), Fourth Symposium On Salt (pp. 101-118). Northern Ohio Geological Society, Inc.
Boys, C. (1990). The geology of potash deposits at PCS Cory mine, Saskatchewan (Master’s thesis, University of Saskatchewan). Harvest. http://hdl.handle.net/10388/etd-09032009-110532
Boys, C. (1993). A geological approach to potash mining problems in Saskatchewan, Canada. Exploration and Mining Geology, 2(2), 129-138.
Broughton, P. L. (2019). Economic geology of southern Saskatchewan potash mines. Ore Geology Reviews, 113, 103117.
Cisyk, D. E. (2020). Salt anomalies in potash beds of the Esterhazy Member, Devonian Prairie Evaporite Formation, Saskatchewan, Canada. Canadian Journal of Earth Sciences, 57(1), 87-101.
Danyluk, T. K., Phillips, G. D., Prugger, A. F., & Pesowski, M. S. (1999). Geophysical analysis of an unusual collapse structure at PCS Potash, Lanigan Division. In Proceedings of the CIM Meeting, Calgary ‘99.
Funk, C. W., Brehm, R., Errington, A. F. C., & Backstrom, K. (2016). An apparatus for collecting upward-looking GPR surveys in potash mines. In 2016 16th International Conference on Ground Penetrating Radar (GPR) (pp. 1-6). IEEE.
Funk, C., Appleyard, J., Braun, J., & Derkach, J. (2017). How geoscientists are making potash mines safer. CSEG RECORDER, 42(04), 12-17.
Funk, C., Isbister, J., LeBlanc, T., & Brehm, R. (2019). Mapping how geophysics is used to understand geohazards in potash mines. CSEG RECORDER, 44(07), 1-6.
Funk, C., Protz, L., van den Berghe, M., & Belanger, Z. (2020). Insights gained after five years of continuous GPR use in potash mines. In 18th International Conference on Ground Penetrating Radar (pp. 136-139). Society of Exploration Geophysicists.
Gendzwill, D. J. (1978). Winnipegosis mounds and Prairie Evaporite Formation of Saskatchewan—seismic study. AAPG Bulletin, 62(1), 73-86.
Gendzwill, D. J., & Stead, D. (1992). Rock mass characterization around Saskatchewan potash mine openings using geophysical techniques: a review. Canadian Geotechnical Journal, 29(4), 666-674.
Kallweit, R. S., & Wood, L. C. (1982). The limits of resolution of zero-phase wavelets. Geophysics, 47(7), 1035-1046.
LeBlanc, T. J., & Butler, S. L. (2024). Detection of a Permeable Aquifer Geohazard Above Potash Mines using In-mine Time-domain Electromagnetics. Journal of Environmental and Engineering Geophysics, 29(4), 127-141.
Okonkwo, V., Van Den Berghe, M., Funk, C. & Paranjape, R (2023). Borer GPR Interpretation During Potash Mining, 2023 IEEE Canadian Conference on Electrical and Computer Engineering (CCECE), Regina, SK, Canada, pp. 428-431, doi: 10.1109/CCECE58730.2023.10289022.
Scott, W. J., (2014). Geophysics for mineral exploration: A manual for prospectors, Newfoundland Department of Natural Resources (NDNR) – gov.nl.ca, Retrieved August 30, 2024, from https://www.gov.nl.ca/iet/files/mines-prospector-matty-mitchell-virtual-geophysics-mineral-exploration-march2014.pdf.
Yang, C., Jensen, G., & Berenyi, J. (2009). The stratigraphic framework of the potash-rich members of the Middle Devonian upper Prairie Evaporite Formation, Saskatchewan. Summary of Investigations, 1, 2009-4.

Todd LeBlanc, B. Sc., M. Sc., is a member of the GeoServices and Land group at Nutrien and is currently pursuing a Ph. D. at the University of Saskatchewan. Todd is a geophysicist specializing in electromagnetic (EM) techniques. Todd has worked in a variety of mining, exploration and environmental roles over the years, and has experience in the uranium, gold and potash industries. Todd received a M.Sc. degree in 2020 from the University of Saskatchewan. Since joining Nutrien in 2022, Todd’s role has been in application of EM methods to both engineering and environmental problems related to potash mines.
Matthew van den Berghe, B.Sc., P.Geo., is a Senior Geophysicist in the GeoServices group at Nutrien. He studied at the University of Saskatchewan obtaining a Bachelor’s degree in Geophysics (2012) with honors. Matthew has worked at Nutrien for 12 years where he is currently responsible for leading geophysical initiatives at Nutrien’s potash mines. These include seismic exploration, in-mine geophysical investigations of anomalous geohazards, and research and development projects. Over the last decade, Matthew has contributed significantly to ground penetrating radar (GPR), mining seismicity, and other mining geophysical methods.


Nathan Morgan, P.Geo, is the Manager of the GeoServices group at Nutrien in Saskatoon, Saskatchewan. He holds a B.Sc. in Geology from the University of Saskatchewan (2009) and has over a decade of experience in exploration, consulting, and mining geology. Specializing in Saskatchewan’s potash sector, Nathan has applied his expertise across diverse geological settings, including operations in South Africa, South America, and Canada. His work focuses on developing innovative solutions to geological challenges in underground mining environments. In his current role, he oversees geological and geophysical initiatives across Nutrien’s potash mines, contributing to resource management, risk mitigation, mine planning, developing exploration strategies and technical support.
Craig Funk, P.Eng, P.Geo is the Director of GeoServices & Land at Nutrien. Craig studied at the University of Saskatchewan where he earned a B. Sc. in Engineering Geophysics and an M. Sc. in Geophysics. Craig has worked in hard- and soft-rock mining, geotechnical consulting, and the oil and gas services industry. Ten years of his career were focused on development of microseismic technology for hard-rock mining and hydrofracking applications. He has worked in a variety of locations, including South Africa, United States, and Canada. In Calgary, he worked for Pinnacle, developing microseismic data management software. Craig has been on the Earth Sciences team at PotashCorp since 2008. PotashCorp merged with Agrium in 2018 to become Nutrien Ltd. The GeoServices & Land group, which Craig manages at Nutrien, is responsible for the exploration and land portfolio for potash, and provide technical support for mine planning, operations, and safety.

Leave A Comment